
Markets often experience some of their heaviest activity shortly after the opening bell.
Overnight news is being absorbed. Institutional orders are entering the market. Traders are reacting to premarket developments, earnings reports, analyst actions and economic data.
The Opening Range Breakout, commonly called ORB, attempts to turn that early activity into a defined trading framework.
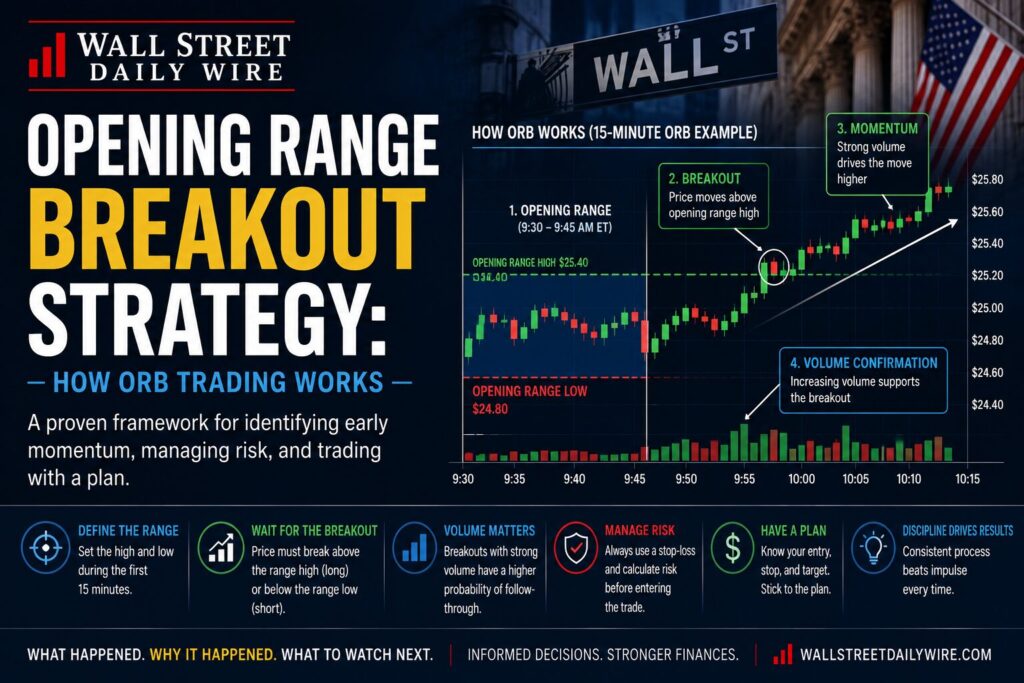
The concept is relatively simple: establish a stock’s high and low during a predetermined period immediately after the market opens, then watch for the price to break beyond that range.
Executing the strategy successfully is considerably more complicated.
A price moving above its opening-range high doesn’t automatically make it an attractive trade. Volume, liquidity, catalysts, broader market conditions and risk management can all matter.
Here’s how the strategy works.
What Is an Opening Range?
The opening range is the price range established during a specified period following the opening bell.
For U.S. stocks, regular trading begins at 9:30 a.m. Eastern Time.
A trader using a 15-minute opening range would therefore watch the stock from 9:30 through 9:45 a.m.
Suppose a hypothetical stock trades as follows during that period:
Opening-range high: $25.40
Opening-range low: $24.80
Those two prices establish the initial range.
A move above $25.40 becomes a potential bullish breakout.
A move below $24.80 becomes a potential bearish breakdown.
The range itself is easy to identify.
Determining whether the breakout is worth trading is the more important question.
5-Minute vs. 15-Minute vs. 30-Minute ORB
There isn’t one universally accepted opening-range duration.
Three commonly followed periods are:
5-minute ORB: 9:30–9:35 a.m.
15-minute ORB: 9:30–9:45 a.m.
30-minute ORB: 9:30–10:00 a.m.
Shorter ranges identify potential moves sooner but can contain more opening volatility and market noise.
Longer ranges provide additional information about how buyers and sellers are behaving but can result in later entries after part of the move has already occurred.
For Wall Street Daily Wire’s ORB coverage, we’ll generally emphasize the 15-minute opening range unless otherwise stated.
That gives us a consistent benchmark for future watchlists.
The Basic Bullish ORB
Consider a hypothetical company, ABC Corp., entering the session after announcing better-than-expected earnings.
The stock trades heavily in premarket trading and opens at $24.95.
During the first 15 minutes:
High: $25.40
Low: $24.80
At 9:47 a.m., shares move through $25.40.
Technically, the stock has broken its opening range.
But an ORB trader shouldn’t necessarily stop the analysis there.
The trader might ask:
Is volume expanding?
Is the stock holding above $25.40?
Was there a legitimate catalyst behind the premarket activity?
Is the broader market supporting the move?
Is there nearby resistance?
A breakout accompanied by strong participation can look considerably different from a brief move a few cents above the range followed immediately by selling.
Volume Matters
Volume can provide important context for a breakout.
Suppose ABC trades above $25.40 on unusually heavy volume.
That suggests meaningful market participation.
Now imagine the same stock moves from $25.39 to $25.43 on very light volume and immediately falls back to $25.25.
Both technically traded above the opening-range high.
They aren’t necessarily equivalent signals.
ORB traders often look for increased volume as evidence that the breakout has broader participation behind it.
Volume does not guarantee success.
It can, however, help distinguish a potentially meaningful move from ordinary price fluctuation.
Why Catalysts Matter
One of the most useful ORB screening techniques happens before the opening bell.
Rather than watching every publicly traded company, traders can focus on stocks already experiencing unusual activity.
Potential catalysts include:
- earnings reports,
- earnings guidance,
- FDA or clinical-trial developments,
- mergers and acquisitions,
- major contracts,
- analyst upgrades or downgrades,
- regulatory developments,
- significant corporate announcements, and
- major industry news.
A stock that is already moving because investors are reassessing the company can provide a more understandable setup than a stock moving without an identifiable catalyst.
This is one reason WSDW’s future ORB watchlists should identify the catalyst, not simply a ticker and potential breakout level.
Premarket Volume
Premarket trading can provide another clue.
Suppose a stock normally trades 500,000 shares during an entire session but has already traded 300,000 shares before 9:30 a.m.
Something unusual is happening.
That doesn’t tell us whether the stock will rise or fall after the opening bell.
But it tells us traders are paying attention.
Relative volume can therefore become an important screening tool when constructing an ORB watchlist.
Premarket Highs and Lows Matter Too
The opening range isn’t the only level worth watching.
Premarket highs and lows can become important areas of support or resistance.
Imagine:
Premarket high: $25.75
15-minute ORB high: $25.40
A breakout through $25.40 might initially look bullish.
But the stock could encounter additional resistance only $0.35 higher at the premarket high.
That affects the trade’s potential risk/reward.
Good ORB analysis therefore looks beyond one line on the chart.
The False Breakout Problem
One of the greatest weaknesses of breakout strategies is the false breakout.
A stock crosses the opening-range high.
Buyers enter.
Then the stock reverses and falls back inside the range.
This is sometimes called a failed breakout.
Suppose ABC has an ORB high of $25.40.
Shares move to:
$25.42
$25.47
$25.51
Then sellers appear.
Within minutes, the stock trades back to $25.30.
The breakout failed to hold.
This illustrates an important distinction:
Breaking a level and holding a level aren’t the same thing.
Some traders therefore wait for additional confirmation rather than entering the instant a stock crosses its ORB high.
The trade-off is straightforward.
Waiting may reduce exposure to some false breakouts—but it can also result in a worse entry if the stock continues moving rapidly.
There is no method that eliminates that trade-off.
Retesting the Breakout Level
Another approach involves waiting for a retest.
Suppose the ORB high is $25.40.
The stock breaks to $25.65, then pulls back toward $25.40.
If buyers appear around the former resistance level and the stock begins moving higher again, traders may interpret that as confirmation that resistance has become support.
Again, this isn’t guaranteed.
The stock can just as easily fall through the level.
The purpose of the retest is not to predict the future with certainty. It is to provide additional information about how the market is responding to an important price level.
Risk Management Comes First
A trading strategy without a risk framework is incomplete.
Before entering an ORB trade, a trader should know where the original thesis would be considered invalid.
That point can then help define potential loss.
Suppose a hypothetical trade has:
Entry: $25.50
Stop: $25.20
The theoretical risk is:
$0.30 per share.
If a trader purchased 100 shares, that represents approximately $30 of planned price risk, excluding slippage, fees and execution differences.
Position size can therefore be determined from the amount of capital the trader is willing to risk—not simply from how much buying power is available.
That distinction is critical.
Risk/Reward
Now suppose the same hypothetical trade has:
Entry: $25.50
Stop: $25.20
Potential target: $26.10
Potential downside to the stop:
$0.30
Potential upside to the target:
$0.60
That produces a theoretical 2:1 reward-to-risk relationship before accounting for execution differences.
This does not mean the trade has a 2:1 probability of succeeding.
Risk/reward and probability are different concepts.
A strategy can produce attractive theoretical reward/risk ratios and still lose money if its success rate is too low.
That’s why traders need to evaluate the strategy across many trades rather than judging it from one successful example.
Profit Targets
There are several ways traders may approach exits.
Some use predetermined percentage targets.
Others use multiples of the initial risk—sometimes called R multiples.
Others watch technical resistance, previous highs, VWAP, premarket levels or momentum deterioration.
A trader might also take partial profits while allowing part of the position to continue.
No single exit method works under every market condition.
The important point is that an exit plan should generally exist before emotions begin influencing the trade.
What About 10%, 20% and 30% Targets?
WSDW watchlists may sometimes display hypothetical 10%, 20% and 30% levels to illustrate what various upside moves would represent.
These should not be interpreted as predictions.
If a reference price were $20:
10% higher: $22
20% higher: $24
30% higher: $26
Those numbers are mathematical reference points—not statements that the stock is expected to reach them.
This distinction should remain explicit in our daily watchlists.
ORB Works in Both Directions
Opening Range Breakout is often discussed as a bullish strategy, but the framework can also identify downside momentum.
Suppose a stock’s opening range is:
High: $31.20
Low: $30.40
A move below $30.40 can represent an opening-range breakdown.
Short selling introduces additional risks and complexities, however, including potentially unlimited losses, borrowing availability and the possibility of rapid short squeezes.
For that reason, WSDW watchlists can identify bearish technical setups without presenting them as instructions to initiate short positions.
Broader Market Conditions Matter
Individual stocks don’t trade in isolation.
A technology stock may struggle to sustain a breakout if the Nasdaq is falling sharply.
A bank stock can react to movements in Treasury yields.
An oil producer may respond to crude prices.
Small-cap stocks can be influenced by the Russell 2000.
Before evaluating an ORB setup, traders should understand what the broader market and relevant sector are doing.
A strong stock fighting against a sharply declining market can behave differently from the same stock during a broad risk-on session.
Liquidity and Spreads
A stock moving 20% in premarket trading can look exciting.
That doesn’t necessarily make it tradable.
Thinly traded securities can have wide bid-ask spreads and significant price gaps between available orders.
A trader may believe the entry is $5.00 but receive an execution at $5.10.
The same problem can occur when attempting to exit.
This is called slippage, and it can materially change real-world results.
Liquidity should therefore be considered alongside volatility.
Low-Priced Stocks Require Additional Caution
Stocks trading at very low prices can experience extraordinary percentage movements.
They can also carry extraordinary risk.
Small companies may have limited operating histories, weak balance sheets, dilution risk and relatively small public floats.
A low share price does not mean a stock is inexpensive in a valuation sense.
And a large premarket percentage gain does not mean momentum will continue after the opening bell.
ORB can provide a framework for analyzing price action.
It cannot transform a highly speculative security into a low-risk investment.
An Example ORB Checklist
Before considering an opening-range setup, a trader might ask:
- What is the catalyst? Is there identifiable news driving attention?
- Is premarket volume unusual? Does the stock have meaningful participation?
- Where are the premarket high and low? These can become additional technical levels.
- What are the 15-minute ORB high and low?
- Is volume expanding at the breakout?
- Is the broader market supporting the direction of the trade?
- Where would the setup be invalidated?
- What is the potential reward relative to that risk?
- Is liquidity sufficient for reasonable execution?
- Is the trader following a predefined plan rather than chasing price?
That checklist doesn’t predict whether a trade will work.
It creates a repeatable decision process.